


Why Summit County listings fail, and what it costs
About a third of listings never sell. Price band predicts it far better than season does, and a failed listing is expensive in a way most sellers never see coming.
Written by Tucker Zimmerman, Summit County Realtor with Slifer Smith & Frampton
Failed listings are the most underreported thing in real estate. They quietly disappear from the market, nobody writes a press release, and the next seller has no idea how common the outcome is.
It is common. In Summit County it has been getting steadily more common.
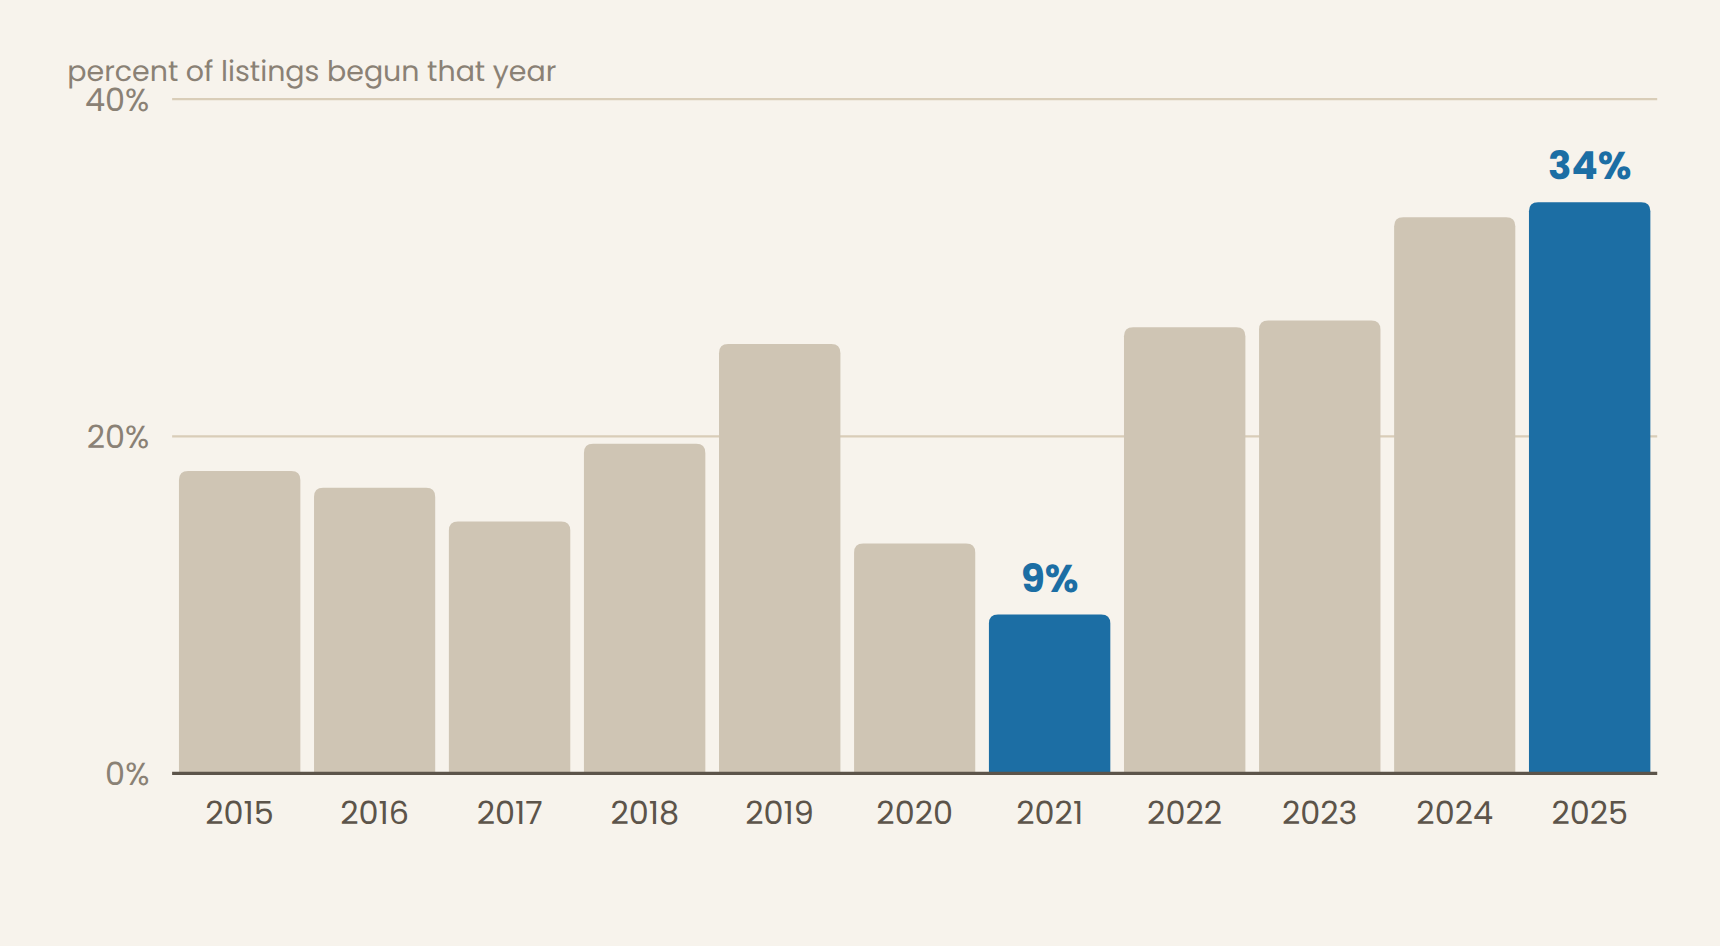
| Listings begun in | Failed to sell | Listings |
|---|---|---|
| 2015 | 17.9% | 2,171 |
| 2016 | 16.9% | 2,183 |
| 2017 | 14.9% | 2,236 |
| 2018 | 19.5% | 2,292 |
| 2019 | 25.4% | 2,487 |
| 2020 | 13.6% | 2,465 |
| 2021 | 9.4% | 2,276 |
| 2022 | 26.4% | 1,827 |
| 2023 | 26.8% | 1,652 |
| 2024 | 32.9% | 1,999 |
| 2025 | 33.8% | 1,982 |
In 2017, about 15% of listings came off the market without selling. In 2024 and 2025 it was closer to a third. The 2021 figure of 9.4% is the anomaly, not the baseline. That was a market where nearly everything sold, and it reset a lot of expectations that have not adjusted since.
If you are pricing off what happened in 2021, you are pricing off the single most unusual year in the dataset.
Price is the biggest predictor by a wide margin
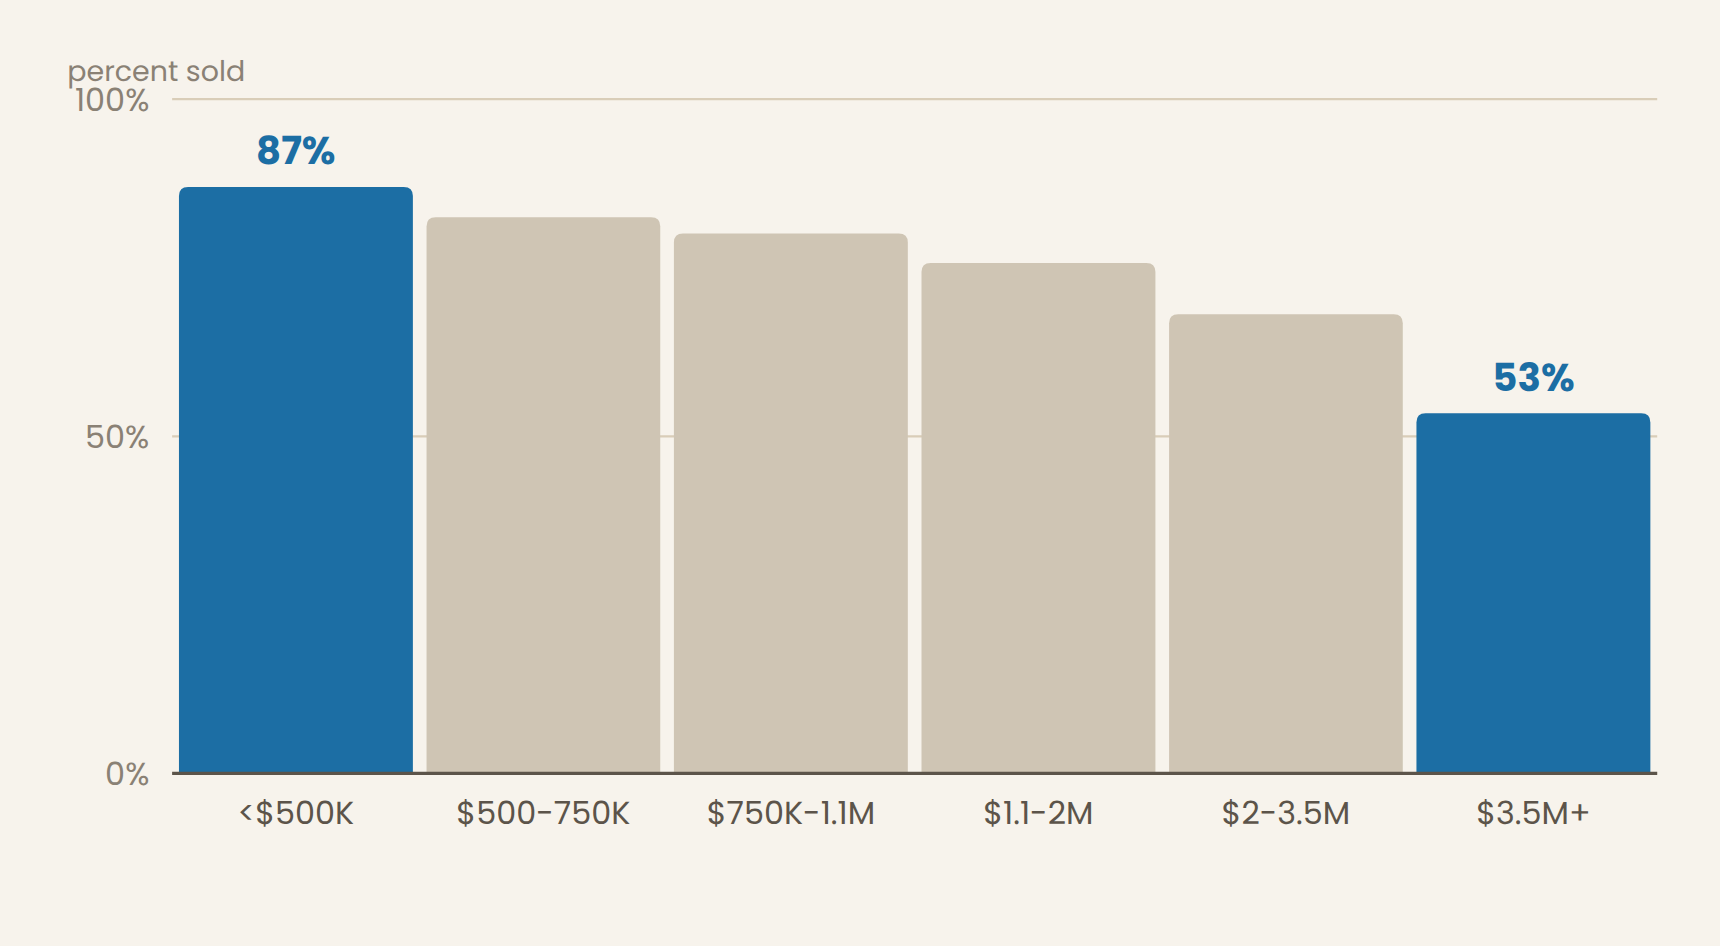
| Price band | Sold | Median days to contract | Listings |
|---|---|---|---|
| <$500K | 87.0% | 14 | 6,116 |
| $500-750K | 82.5% | 18 | 5,040 |
| $750K-1.1M | 80.1% | 19 | 4,017 |
| $1.1-2M | 75.7% | 27 | 4,058 |
| $2-3.5M | 68.1% | 49 | 1,644 |
| $3.5M+ | 53.4% | 76 | 713 |
Sell-through falls from 87% under $500,000 to 53% above $3.5 million. Above that line, listing your property is closer to a coin flip than a plan, and the median time to contract stretches to 76 days for the ones that do work.
This is structural rather than seasonal. There are simply fewer buyers at the top of this market, and no listing month fixes that. What it means practically is that a high-end seller needs a longer runway, more patience, and a much more careful first price, because the cost of being wrong is higher and the correction takes longer.
What actually separates the listings that sell
I ranked the factors by how much they moved the odds of selling. The order surprised me. Competition at listing came in fourth, which is lower than I expected given how much it affects how long a property sits.
| Rank | Factor | Spread in sell-through |
|---|---|---|
| 1 | Price band | 32.9 points |
| 2 | Property type | 12.9 points |
| 3 | Whether the price was reduced | 12.4 points |
| 4 | Competition at listing | 7.9 points |
| 5 | Town | 5.4 points |
| 6 | Season listed | 1.3 points |
Season came last, by a lot. This is worth sitting with, because timing is what sellers ask about most. The month you list clearly affects how well and how fast you sell. It barely affects whether you sell. Both things are true at once.
Single family homes look like the worst performing type in the raw numbers, at 74.6% sold. But once you control for price, houses are actually more likely to sell than condos. Houses fail because they cost more, not because they are houses. That kind of sign flip is exactly why raw comparisons mislead people.
What a failed listing costs you
A failed listing is not a neutral do-over. I tracked 2,070 properties that failed once and later sold.
Twenty days versus five hundred and seventy-two. The reason is almost always the same: the first price was wrong, the market said so, and it took a year and a half of carrying costs to get to a number that would have worked at the start. The pricing page has the full chart.
The MLS hides most of this
About one listing in eight in Summit County has been on the market before under a previous listing. When a listing is withdrawn and relisted, the days-on-market counter usually starts over.
Properties that failed and eventually sold displayed a median 32 days on the winning listing against 572 days of actual elapsed marketing time. The number a buyer sees is often around six percent of the real history.
This cuts both ways. As a seller it means a fresh-looking listing does not always mean a fresh property, so check cumulative days on market on your competition. As a buyer it means the same thing, which is why I always pull the full listing history before advising anyone on an offer.
Does switching agents fix a failed listing?
About 37% of the failed-then-sold properties changed listing agents along the way. So this is a common response, and the obvious question is whether it works.
Once you account for the price cut that usually came with the switch, changing agents showed no measurable improvement in what the property eventually sold for. Switching was associated with about 31% more total time, which is almost certainly the struggling listing causing the switch rather than the switch causing the delay. This only looks at properties that eventually sold, so it says nothing about whether a different agent gets a stuck listing sold at all.
Which is not to say the agent does not matter. It says the agent matters most at the beginning, when the price gets set. A new sign at the same price is not the fix.
If your listing is not working
- Check showing activity first. No showings is a price and exposure problem. Showings with no offers is usually a condition or expectation problem.
- Compare against what actually sold, not what is listed. Active listings tell you what sellers hope for. Closed sales tell you what buyers did.
- Look at your real competition. If three similar units came on below you after you listed, your position changed and your price has not.
- Make one meaningful move rather than three small ones. Grinding down in small steps took longer and did not end better.
- Decide whether to withdraw and regroup. Sometimes the right answer is to come off, fix what is wrong, and relaunch properly rather than keep bleeding days.
Common questions
About a third of listings begun in 2024 and 2025 came off the market without selling, up from about 15% in 2017. Above $3.5 million the failure rate was closer to half.
Price band was by far the strongest predictor, with a 32.9 point spread in sell-through between the lowest and highest bands. Property type, whether the price was reduced, competition and town followed. Season listed came last, at a 1.3 point spread.
Properties that failed once and later sold got 93.7% of their original asking price after a median 572 days from first listing, compared to 97.8% in 20 days for properties that sold on the first attempt.
Not by itself. Once the price reduction that usually accompanied a switch was accounted for, changing listing agents showed no measurable improvement in sale price. About 37% of failed-then-sold properties switched agents. This only looks at properties that eventually sold, so it says nothing about whether a different agent gets a stuck listing sold at all.
Usually yes. About one listing in eight in Summit County has been on the market before. Properties that failed and later sold showed a median 32 days on the winning listing against 572 days of actual elapsed marketing time.
Where to go next
If you would rather just talk it through
If your listing is not working right now, or if it recently came off the market, I will look at it and tell you what I think went wrong. No obligation attached and I am comfortable telling you the previous agent did nothing wrong if that is what I find.
You can see how I work with sellers, request a property value review, or just call. I do not run a hard follow up sequence, and I am fine with a conversation that ends in you deciding not to sell.
Associate Broker, Slifer Smith & Frampton Real Estate. Based in Frisco, working across Summit County.
(303) 907-9129 · TZimmerman@SliferSummit.com · Contact page
Back to the Seller Playbook · about Tucker · Summit County homes for sale
How I ran this, sample sizes, and what the data did not show (optional, for the skeptical)
Most readers can skip this. It is here so anyone who wants to check my work can.
Every residential listing in the Summit MLS from 2015 through early 2026, across Breckenridge, Frisco, Silverthorne, Dillon, Keystone, Copper Mountain, Blue River, Wildernest, Heeney, Summit Cove and Montezuma. About 26,000 records before cleaning, 25,230 after. Single family, condo, townhouse and duplex. Pulled as record level MLS exports, not from aggregate reports. Every price finding on this page is computed only on the 19,610 listings that sold. The 5,371 that expired or were withdrawn have no sale price, so they sit outside those numbers.
Expired plus withdrawn as a share of all listings begun in that calendar year. Grouped by listing start date rather than end date, so a listing begun in December 2024 and expired in 2025 counts to 2024. Withdrawn and expired are always combined because of a coding change around 2020.
Each factor's spread is the difference in sell-through between its highest and lowest group. This ranks how much each factor separates outcomes, not a causal decomposition. The property type reversal comes from a logistic model with price controlled, where single family shows odds about 1.31 times condo despite a worse raw rate.
Estimated within the 2,070 failed-then-sold chains, controlling for the change in list price between the failed and winning listings. Effect on sale price -0.16 percentage points, p=0.63, confidence interval -0.84 to +0.51.
- The MLS shifted from coding failed listings as withdrawn to coding them as expired around 2020. The two are always combined here.
- Summit County transaction counts are small. A handful of high priced closings can move a countywide median. Where a cell was too thin to say anything, I left it out rather than publishing it.
- Everything here is observational. Sellers choose when to list, what to fix and what to ask, and those choices are not random. These are patterns in what happened, not proof of what causes what.
- Relist matching is by address across listing records. Properties that changed address formatting between listings may be undercounted, so one in eight is a floor rather than a ceiling.
Reporting only the findings that worked would make this an advertisement. These did not:
- Switching agents did not raise the price. A tightly bounded zero, not an inconclusive result. The apparent association with longer timelines runs the other direction causally.
- Season barely predicts failure. Last of six factors at a 1.3 point spread, against 32.9 points for price band. Timing matters for outcome quality, not for whether a sale happens.
- Houses are not worse than condos. The raw sell-through gap reverses once price is controlled, which means the raw comparison was measuring price the whole time.
Analysis run August 2026 on listings through early 2026. Current conditions are deliberately not in these pages. Information is deemed reliable but not guaranteed. This is general information about market patterns, not advice about your specific property, and nothing here is legal or tax advice.