


When is the best time to sell in Summit County?
Sellers list in June. Buyers go under contract in August and September. That gap is the most useful thing I found in ten years of local data.
Written by Tucker Zimmerman, Summit County Realtor with Slifer Smith & Frampton
Everyone in this county will tell you summer is the time to sell. The tourists are here, the flowers are out, the photos look great. It is one of those things that sounds so obviously right that nobody checks it.
I checked it. The picture is more interesting than that.
Sellers and buyers do not show up in the same months
| Month | New listings | Contracts signed |
|---|---|---|
| Jan | 115 | 84 |
| Feb | 136 | 89 |
| Mar | 186 | 116 |
| Apr | 182 | 108 |
| May | 248 | 121 |
| Jun | 291 | 141 |
| Jul | 255 | 177 |
| Aug | 225 | 195 |
| Sep | 177 | 182 |
| Oct | 133 | 138 |
| Nov | 97 | 94 |
| Dec | 98 | 80 |
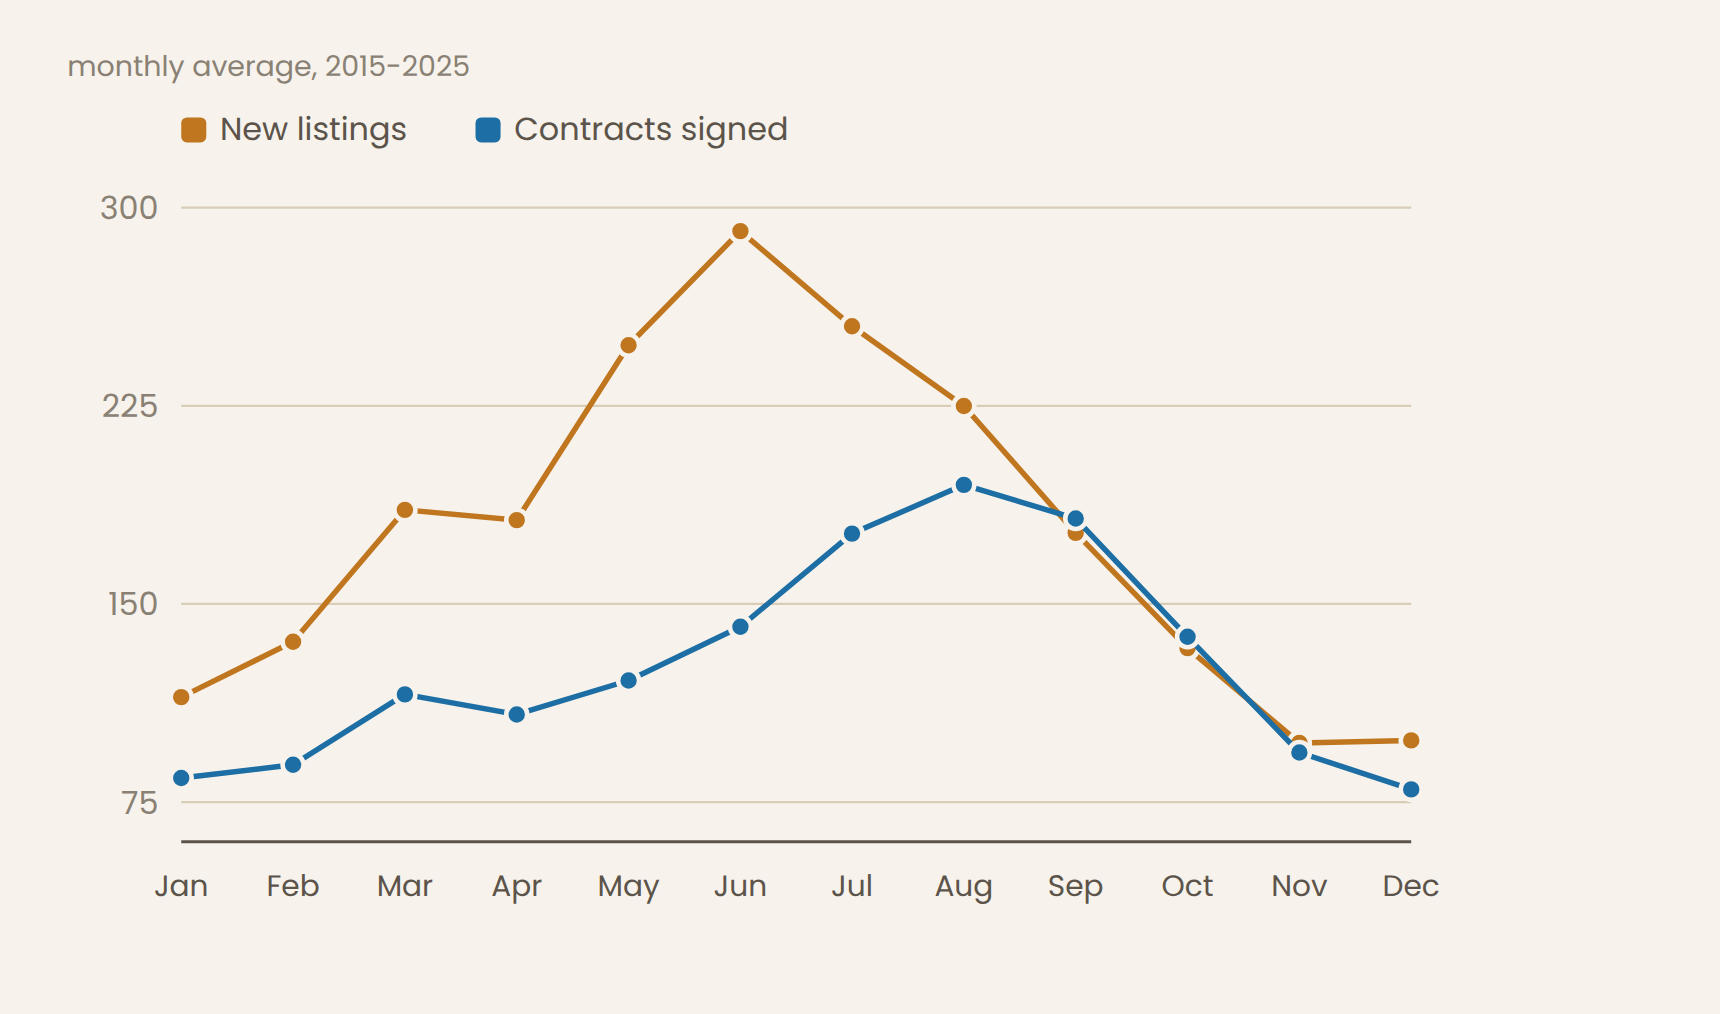
Seller supply peaks hard in June. Buyer contracts peak in August and September. Those are different months, and the gap between the two lines in early summer is the whole story.
In June, roughly 291 new listings hit the market against about 141 contracts signed. By September the relationship has flipped: about 177 new listings against 182 contracts. Same county, same buyers, completely different competitive position depending on when you walk in the door.
June is the most crowded month to list. It is not the best month to sell. Those get confused constantly, and the confusion is expensive.
What that did to the numbers
| Listed in | Single family | Condo |
|---|---|---|
| Jan | 97.7% | 98.2% |
| Feb | 97.2% | 98.2% |
| Mar | 96.9% | 97.8% |
| Apr | 96.4% | 97.8% |
| May | 96.0% | 97.5% |
| Jun | 95.4% | 97.4% |
| Jul | 95.7% | 98.0% |
| Aug | 96.2% | 98.2% |
| Sep | 97.0% | 98.8% |
| Oct | 97.3% | 98.2% |
| Nov | 96.8% | 98.5% |
| Dec | 97.6% | 98.6% |
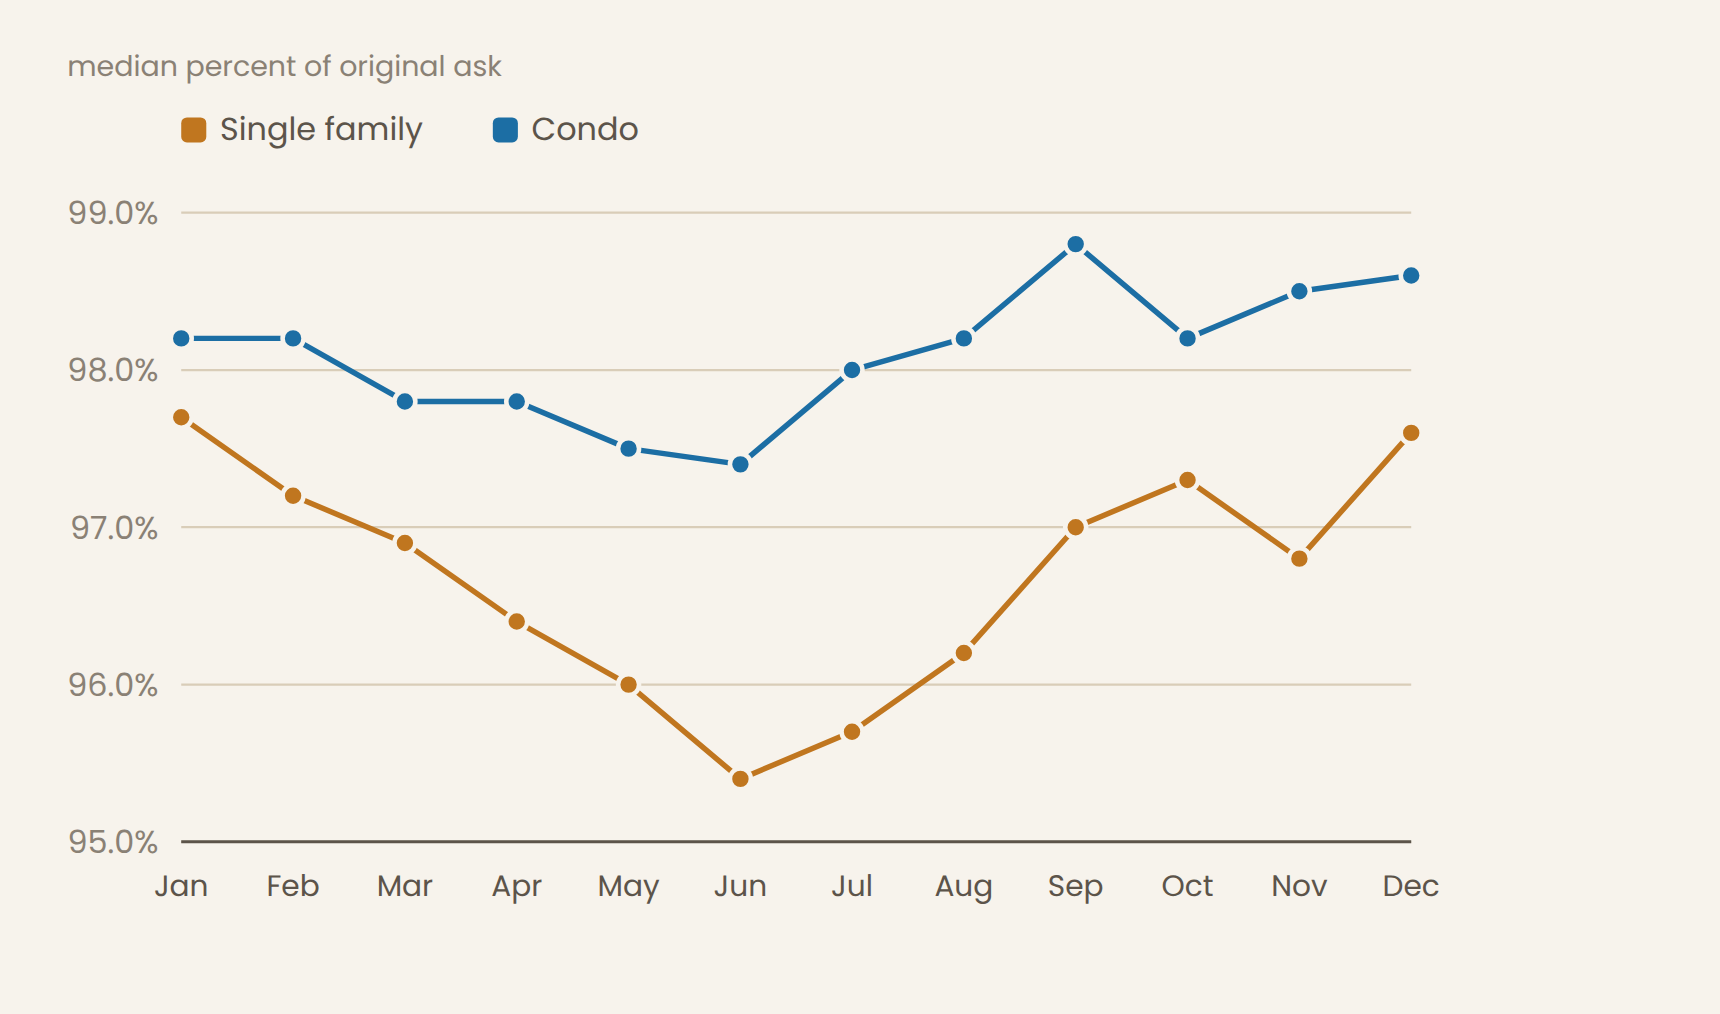
Both lines dip in early summer and recover in fall and winter. Properties listed in June sold at a lower percentage of their original asking price than properties listed in January, and the pattern held after controlling for property type, area, price band, size and year. June listings also took meaningfully longer to go under contract.
Sellers choose when to list. People selling in June may differ from people selling in January in ways I cannot see in the data, including how motivated they are and why they are selling. So this is a consistent pattern in what happened, not proof that the calendar caused it. I would still rather know the pattern than not.
Timing matters about twice as much for a house
Look at the gap between the two lines in the chart above. Single family swings from about 95.4% in June up to about 97.7% in January, a spread of roughly 2.3 points. Condos swing from about 97.4% to 98.8%, a spread of about 1.4.
Condos are more interchangeable, more often bought by second home buyers on their own schedule, and less tied to the seasonal rhythm. Houses are the opposite. If you own a single family home, the calendar is one of the larger levers you have. If you own a condo, it matters, but less.
Price changes the answer too
The higher the price, the larger the seasonal swing, and the later in the year the good window sits. Below about $750,000 the strongest results clustered in fall. Above about $1.1 million they clustered in winter.
| Price band | Sold within the listing period | Median days to contract |
|---|---|---|
| <$500K | 87.0% | 14 |
| $500-750K | 82.5% | 18 |
| $750K-1.1M | 80.1% | 19 |
| $1.1-2M | 75.7% | 27 |
| $2-3.5M | 68.1% | 49 |
| $3.5M+ | 53.4% | 76 |
That last column is the one to sit with. A property under $500,000 went under contract in a median 14 days. Above $3.5 million it took 76. At the top of the market, the problem is structural rather than seasonal, and no listing month fixes it. More on that here.
So when should you actually list?
Four things decide it, and only one of them is the calendar.
There is no universal best month. There is a better month for your property given your constraints, and figuring out which one usually takes about fifteen minutes once you have the carrying cost written down.
If you are flexible and nothing else is forcing your hand, the data points away from listing into the June crowd and toward late summer through fall, when buyer demand is at its highest and seller supply has started to thin out. For a higher priced single family home, later still.
Common questions
Buyer contracts peak in August and September while seller supply peaks in June, so listings that went live in late summer through fall faced better conditions. Properties listed in fall and winter sold at a higher percentage of their original asking price than those listed in June. Above roughly $1.1 million the strongest window shifted later, into winter.
June is the most crowded month to list. About 291 new listings hit the market in an average June against about 141 contracts signed. Late summer is better than early summer, because August and September are when buyer contracts peak.
A house. Single family sale prices swung about 2.3 percentage points against the original asking price across the year, roughly double the 1.4 point swing for condos.
The median was 14 days under $500,000, 19 days between $750,000 and $1.1 million, 49 days between $2 million and $3.5 million, and 76 days above $3.5 million.
Usually not on seasonal grounds alone. Spring leads into the most crowded listing window of the year. Whether waiting makes sense depends more on your carrying cost and how prepared the property is than on the month.
Worksheets you can print
Free printable worksheets from this section. No email required.
Where to go next
If you would rather just talk it through
Timing is one of the easier things to get right and one of the easier things to overthink. If you tell me your property type, price range and how flexible you are, I can tell you what the last decade looked like for that specific combination.
You can see how I work with sellers, request a property value review, or just call. I do not run a hard follow up sequence, and I am fine with a conversation that ends in you deciding not to sell.
Associate Broker, Slifer Smith & Frampton Real Estate. Based in Frisco, working across Summit County.
(303) 907-9129 · TZimmerman@SliferSummit.com · Contact page
Back to the Seller Playbook · about Tucker · Summit County homes for sale
How I ran this, sample sizes, and what the data did not show (optional, for the skeptical)
Most readers can skip this. It is here so anyone who wants to check my work can.
Every residential listing in the Summit MLS from 2015 through early 2026, across Breckenridge, Frisco, Silverthorne, Dillon, Keystone, Copper Mountain, Blue River, Wildernest, Heeney, Summit Cove and Montezuma. About 26,000 records before cleaning, 25,230 after. Single family, condo, townhouse and duplex. Pulled as record level MLS exports, not from aggregate reports.
Listings are grouped by the month they went live, not the month they closed. Sale price is measured against the original list price. Ratios outside 0.5 to 1.5 were dropped as data errors.
The seasonal effect was tested in a regression with fixed effects for property type, area, price band, size and listing year, so it is measured within comparable groups. It survived those controls.
New listings are counted by list date. Contracts are counted by the date a property went pending, both averaged across 2015 to 2025.
- The MLS shifted from coding failed listings as withdrawn to coding them as expired around 2020. The two are always combined here.
- Summit County transaction counts are small. A handful of high priced closings can move a countywide median. Where a cell was too thin to say anything, I left it out rather than publishing it.
- Everything here is observational. Sellers choose when to list, what to fix and what to ask, and those choices are not random. These are patterns in what happened, not proof of what causes what.
- Monthly cells above $3.5 million are too thin to report reliably, so that band is discussed seasonally in broad terms only and not month by month.
Reporting only the findings that worked would make this an advertisement. These did not:
- Ski base areas and valley towns do not have different selling seasons. I expected the resort base areas to run on a separate calendar tied to ski season. They do not. Both groups peaked in fall and winter and troughed in spring and summer, and only one of six interaction terms tested significant. Price levels differ between them. The seasonal shape does not.
- Season barely predicts whether a property sells at all. Ranked against price band, property type, whether the price was reduced and competition, listing month came last by a wide margin. Season predicts how well and how fast, not whether.
Analysis run August 2026 on listings through early 2026. Current conditions are deliberately not in these pages. Information is deemed reliable but not guaranteed. This is general information about market patterns, not advice about your specific property, and nothing here is legal or tax advice.