


What 26,000 Summit County listings say about selling a property here
I pulled every residential listing in the Summit County MLS going back to 2015, about 26,000 of them, and spent several weeks asking the questions sellers actually ask me. Some of it confirmed what I already believed. Some of it did not, and those are the parts worth your time.
Written by Tucker Zimmerman, Summit County Realtor with Slifer Smith & Frampton
All of it is free and none of it is behind a form. If a homeowner reads this, works through it, and hires a different agent, I still think that was worth doing. Bad information is what costs people money around here.
Nine things worth knowing before you list
If you read nothing else, read these. Each one has a page behind it with the numbers, the sample size, and what the finding does not prove.
Seller supply peaks in June. Buyer contracts peak in August and September. The data showed listings that went live in the fall and winter finishing closer to their asking price, in every price band I looked at.
See the month by month numbers ›A listing with nothing else like it on the market went under contract in about six days. A listing with twenty-one close substitutes took about forty-nine. Among properties that sold, more competition did not show up in the final price. It did make a price reduction along the way more likely.
How crowded is your shelf ›Whatever a property was asking on the day it sold, it got about 97% of that number, whether it had been listed for a week or a year. Against the original asking price it slides to 91%. That gap is the distance the seller travelled, not a discount that grew with time on market.
What the pricing data shows ›Properties that sold on the first attempt got 97.8% of the asking price in a median 20 days. Properties that failed once and sold later got 93.7% of that first ask, a median 572 days after they started.
What happens to listings that fail ›The failure rate roughly doubled between 2017 and 2024. Above $3.5 million it ran closer to half. This is the number most sellers have no idea about, because failed listings quietly disappear from view.
Why listings fail here ›Reading as dated was associated with roughly a 9% lower price per square foot. Reading as fully remodeled was associated with about 2% higher. That gap is an argument for a refresh and an argument against gutting the kitchen on your way out the door.
What to fix and what to skip ›The day count a buyer sees is often a small fraction of the real marketing history. Relisted properties that eventually sold showed a median 32 days on the winning listing against 572 days of actual elapsed time.
How the MLS hides history ›About a third of the properties that failed once and later sold changed agents along the way. In that group it was the price change that came with the switch that tracked with the outcome, not the switch itself. This only looks at properties that eventually sold, so it says nothing about whether a different agent gets a property sold at all.
How to actually evaluate an agent ›Same county, same decade, two different patterns. Single family sales showed roughly double the seasonal swing that condo sales did.
Timing by property type ›Historical patterns describe what has already happened. They are not a forecast for any one property, and they are not a substitute for looking closely at yours. Every price figure here comes from properties that sold. Listings that never sold have no sale price, so they sit outside these numbers.
Two charts that changed how I price
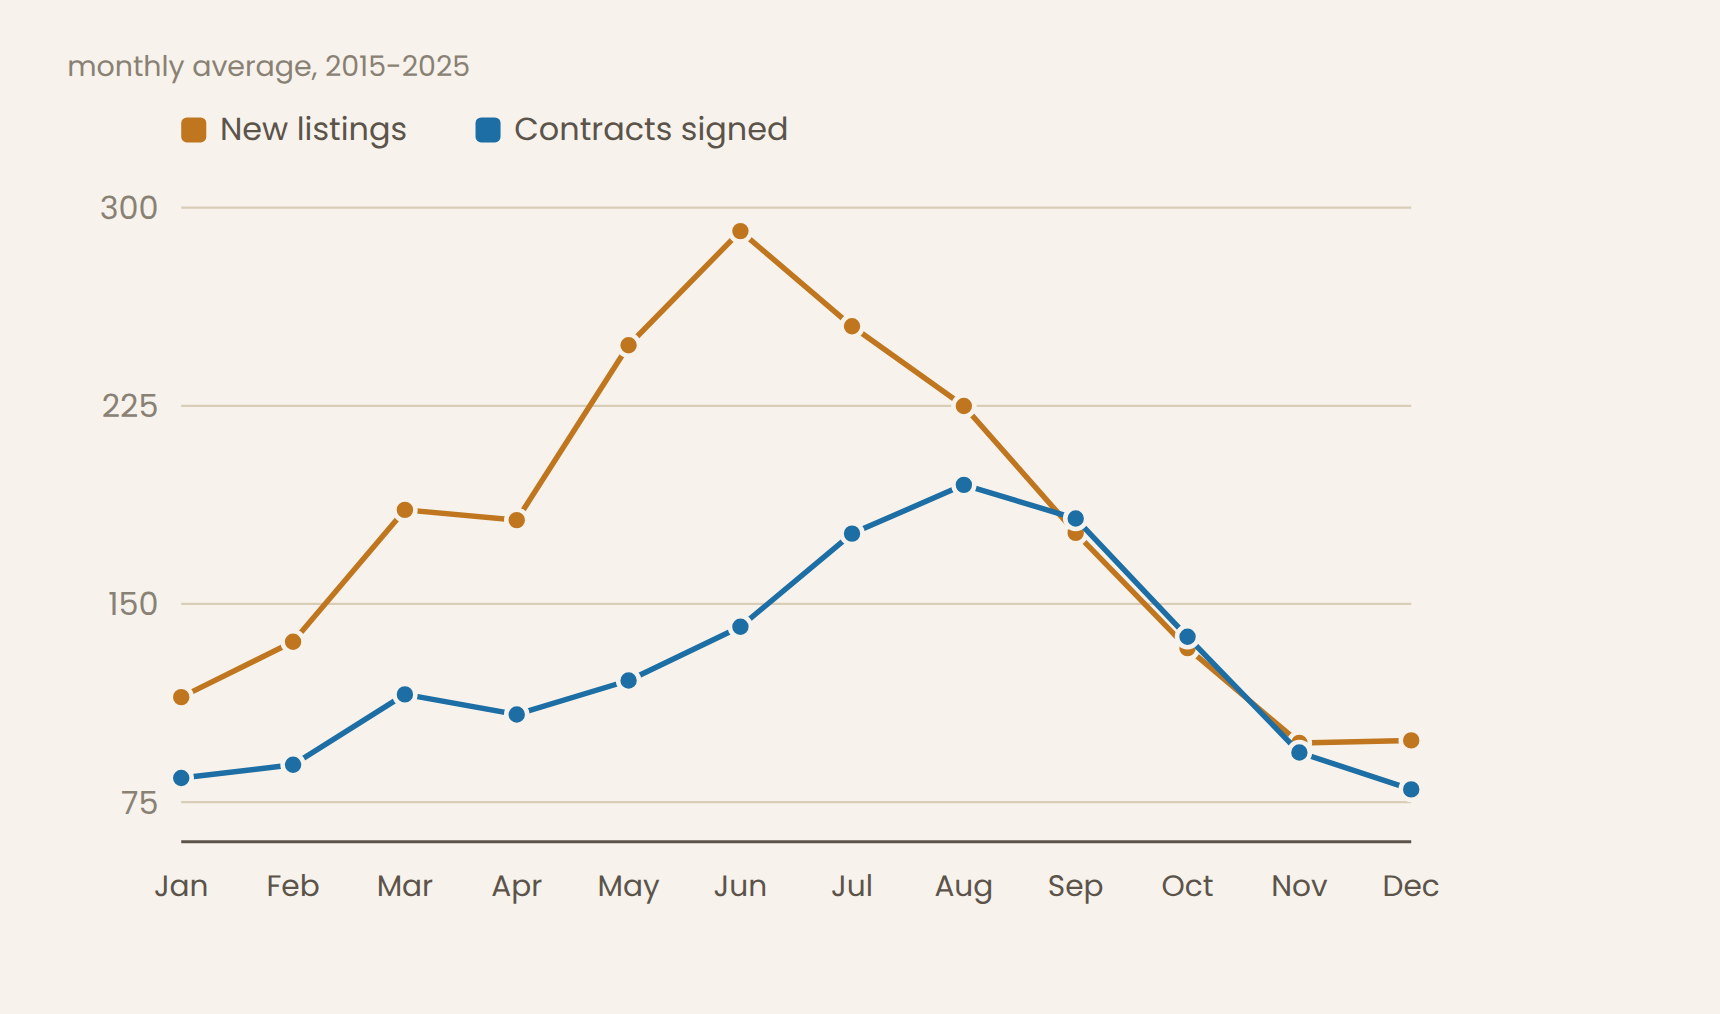
The first one is about timing. Sellers and buyers in Summit County do not show up in the same months, and the gap is bigger than most people expect.
| Month | New listings | Contracts signed |
|---|---|---|
| Jan | 115 | 84 |
| Feb | 136 | 89 |
| Mar | 186 | 116 |
| Apr | 182 | 108 |
| May | 248 | 121 |
| Jun | 291 | 141 |
| Jul | 255 | 177 |
| Aug | 225 | 195 |
| Sep | 177 | 182 |
| Oct | 133 | 138 |
| Nov | 97 | 94 |
| Dec | 98 | 80 |
Supply peaks in June. Demand peaks in late summer. A June listing lands in the most crowded window of the year, which is the opposite of what most sellers assume when they aim for summer.
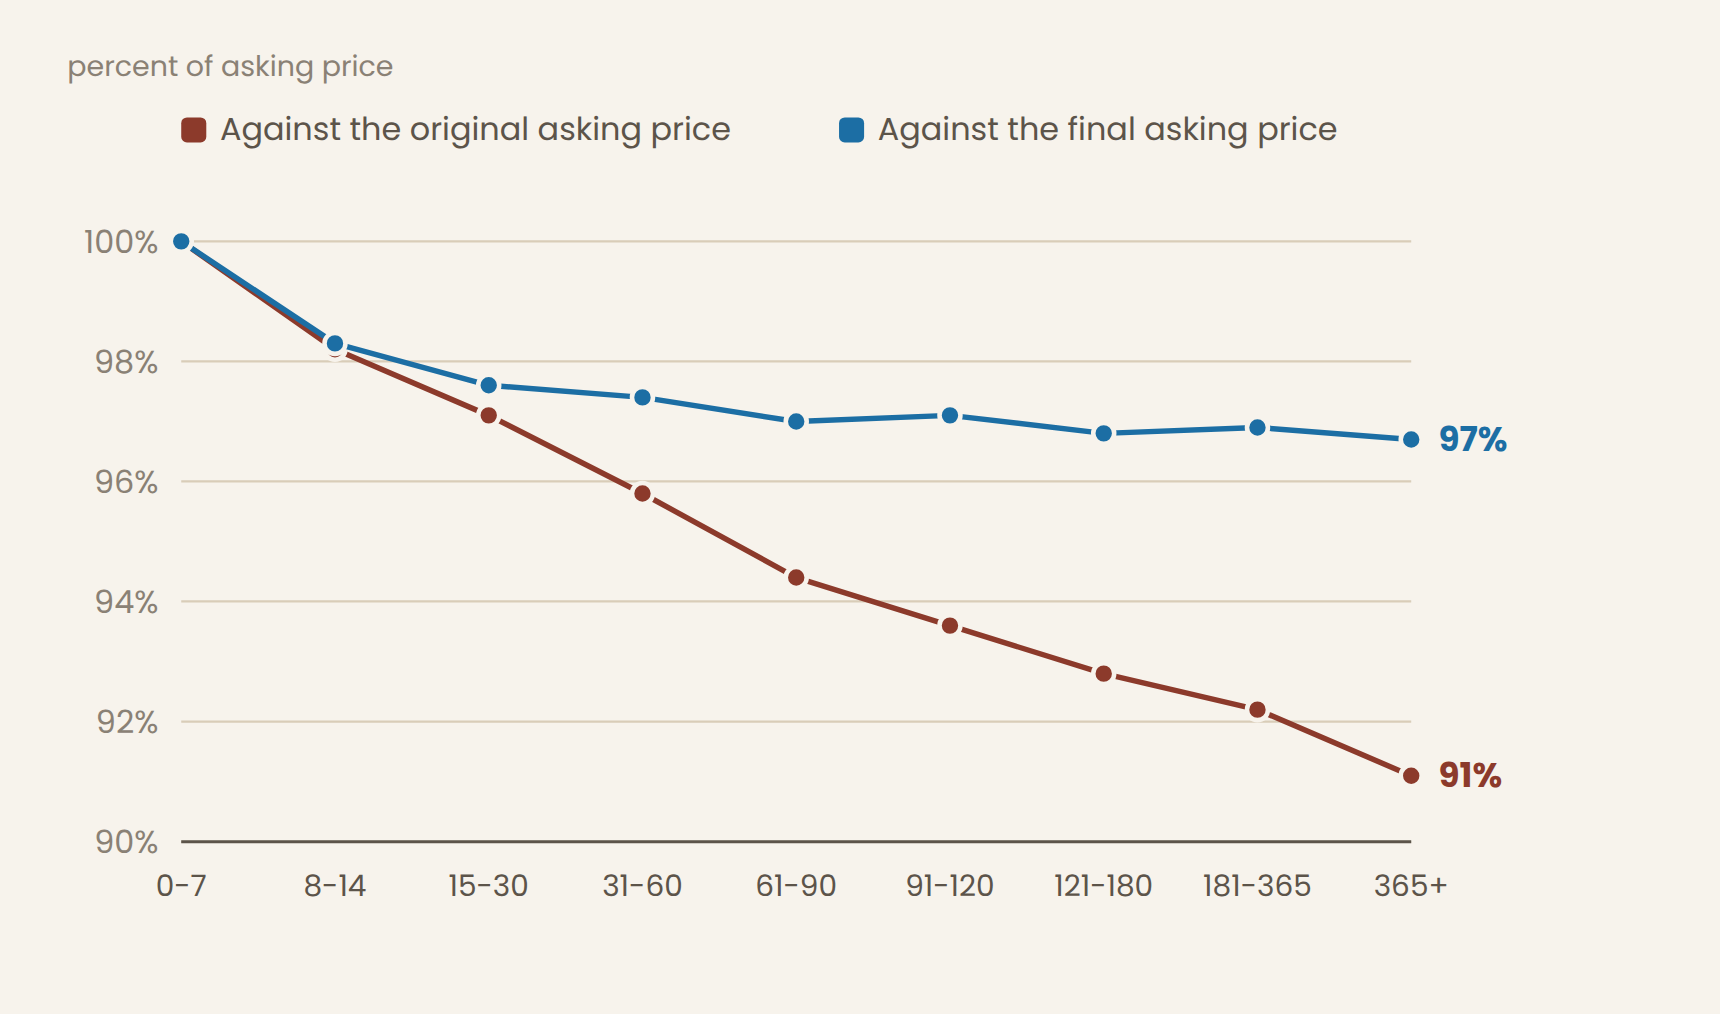
The second one is the one I show every seller who wants to start high and come down later.
| Days on market | % of original ask | % of final ask | Sales |
|---|---|---|---|
| 0-7 | 100.0% | 100.0% | 6,999 |
| 8-14 | 98.2% | 98.3% | 1,760 |
| 15-30 | 97.1% | 97.6% | 2,488 |
| 31-60 | 95.8% | 97.4% | 2,676 |
| 61-90 | 94.4% | 97.0% | 1,583 |
| 91-120 | 93.6% | 97.1% | 1,115 |
| 121-180 | 92.8% | 96.8% | 1,231 |
| 181-365 | 92.2% | 96.9% | 1,217 |
| 365+ | 91.1% | 96.7% | 486 |
The blue line barely moves. Whatever a property was asking on the day it sold, it got about 97% of that number, whether it had been listed for a week or two years. The red line is the cost of the first price being wrong. Buyers were not punishing the listing for sitting. The listing was sitting because of where it started.
The rest of it
Nine pages, organized in the order the decisions actually come up.
Each section has printable worksheets attached to it, twenty-four in total, free and with nothing to fill out first. There is also a 91 page PDF that puts everything in one document, and that one asks for an email address.
Common questions
Seller supply peaks in June and buyer contracts peak in August and September, so June listings face the most competition. In this data, listings that went live in fall and winter finished closer to their asking price. The effect is larger for single family homes than for condos, and larger above $1 million.
About two out of three. Roughly a third of 2024 listings came off the market without selling, up from about 15% in 2017. Above $3.5 million the failure rate ran closer to half.
Not against its current asking price. Summit County sales held near 97% of the final asking price no matter how long the property had been listed. Against the original asking price the figure fell to about 91%, which points to the first price being wrong rather than buyers negotiating harder over time.
Usually not a full remodel. Properties that read as dated sold at roughly 9% lower price per square foot, while fully remodeled ones gained about 2%. Fixing dated is worth more than chasing new.
Only two towns levy one. Breckenridge charges a 1% Real Estate Transfer Tax and Frisco charges a 1% Real Estate Investment Fee. Dillon, Blue River, Montezuma, Keystone and unincorporated Summit County levy none. Silverthorne has no town transfer tax, though a 1% transfer assessment applies as a private covenant in 18 named developments.
No. Every page is free and open. There is a printable PDF with fillable worksheets if you want it, and that one asks for an email, but nothing on the site is behind a form.
Where to go from here
If you are trying to figure out whether selling makes sense at all, start with should you sell. If you already know you are selling and want to get the timing right, start with when to sell.
If you would rather just talk it through, that is usually faster than reading nine pages. I do not run a hard follow up sequence and I am fine with a conversation that ends in you deciding not to sell. You can see how I work with sellers, get a property value review, or just call.
Associate Broker, Slifer Smith & Frampton Real Estate. Based in Frisco, working across Summit County.
(303) 907-9129 · TZimmerman@SliferSummit.com · Contact page
More background: about Tucker · Summit County homes for sale · short-term rental rules by town
How I ran this, sample sizes, and what the data did not show (optional, for the skeptical)
Most readers can skip this. It is here so that anyone who wants to check my work can, and so that the numbers on these pages can be verified rather than taken on faith.
Every residential listing in the Summit MLS from 2015 through early 2026, across Breckenridge, Frisco, Silverthorne, Dillon, Keystone, Copper Mountain, Blue River, Wildernest, Heeney, Summit Cove and Montezuma. About 26,000 records before cleaning, 25,230 after. Property types are single family, condo, townhouse and duplex. Statuses are sold, pending, active, withdrawn and expired. Pulled directly from the MLS as record level exports, not from aggregate reports. Every price finding on this page is computed only on the 19,610 listings that sold. The 5,371 that expired or were withdrawn have no sale price, so they sit outside those numbers.
- The MLS shifted from coding failed listings as withdrawn to coding them as expired around 2020. The two are always combined here. Analyzing them separately across that boundary produces nonsense.
- Summit County transaction counts are small. A handful of high priced closings can move a countywide median. Where a monthly cell was too thin to say anything, I left it out rather than publishing it.
- Condition ratings are classified from listing remarks, which is imperfect. About 54% of listings say nothing usable about condition and are excluded from that analysis entirely.
- Everything here is observational. Sellers choose when to list, what to fix and what to ask. Those choices are not random, so these are patterns in what happened, not proof of what causes what.
Reporting only the findings that worked would make this an advertisement. These did not:
- Competition does not move price. More competing listings clearly slowed a sale, but the effect on sale price was indistinguishable from zero, with a tight confidence interval. I expected a price effect and there wasn't one.
- Switching agents does not raise the price. Once the relist price cut is accounted for, changing listing agents showed no price improvement. Switching was associated with longer total time, which is almost certainly the struggling listing causing the switch rather than the reverse.
- Ski base and valley properties do not have different selling seasons. I expected the resort base areas to run on a different calendar. They do not. Price levels differ, the seasonal shape does not.
- Garages are worth less than people assume. Matched within the same complex on size and bedroom count, the premium came out around 3%, and should be treated as the generous end. Any comparison not matched on square footage is measuring size, not garages.
Analysis run August 2026 on listings through early 2026. Current market conditions are not in these pages by design. For where the market is right now, use the market reports. Information is deemed reliable but not guaranteed. This is general information about market patterns, not advice about your specific property, and nothing here is legal or tax advice.